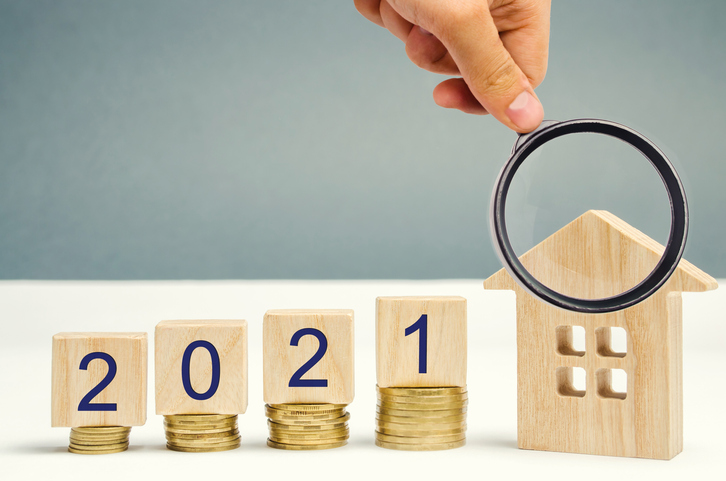
Year-End Real Estate Statistics
The REALTORS® Association of Hamilton-Burlington (RAHB) reported a total of 16,502 sales of residential properties within the RAHB market area for 2021. When compared to 2020 sales of residential properties, we can see that there was an increase of 10.5 per cent. The average price of a residential property in the entire RAHB market area was $867,560. This was a 25.74 per cent increase when compared to 2020.
When we look back at the average price of a residential property in 2011, we can clearly see that there was a 169.89 per cent increase. In 2011 the average price of a residential property in the RAHB market area was $321,449, compared to 2021 when it increased to $867,560.
Total Market Activity

The above chart, Total Market Activity, allows us to see what the average price of a residential property was in 2020 and 2021. We can then compare and see whether the price has increased or decreased in that one year time period.
It was reported that in Hamilton West, there were a total of 925 sales of residential properties in 2021. This is a clear increase when compared to 2020 when there were 752 sales. We can also see what the average price of a residential property was in 2021 it was reported to be $696,667, a clear increase compared to $579,336 in 2020.
Let’s now take a look at Hamilton Centre, we can see there was a total of 1,665 sales in 2021, compared to 2020 when there were 1,367 sales. There was also an increase when it came to the average price of a residential property. In 2021 the average price was reported to be $612,979. While in 2020 the price of a residential property was reported to be $484,020, this was a slight increase when we compare 2020 and 2021.
Finally, we can now take a look at Burlington, it was reported that in 2021 there were a total of 3,507 sales of residential properties. This was an increase compared to the 3,306 sales in 2020. The average price of a residential property also saw an increase when we compare 2020 and 2021. In 2021 the average price of a property was $1,087,000, compared to $887,662.
Average Residential Price by District

The above map, Average Residential Price by District, illustrates each area in Burlington. Allowing us to see each sub area within the city and how many residential sales there were, as well as what the average price of a residential property was.
The sub areas that we need to take note of for 2021 were; 32, 34 and 35. Each of these areas had the greatest number of sales for the year. Particularly area 35, located in the most sought after neighbourhood Millcroft, had a total of 1008 sales. The average price of a residential property in Millcroft in 2021 was reported to be $961,524.
Another area located in Burlington North was area 64, this area had the highest average residential property price in 2021. The average price of a residential property in this area was reported to be $2,302,645. If we take a look at Burlington South, we can see that area 33 had the second highest average price of a residential property in 2021, $1,460,321.
Burlington Residential Table

In this final chart, Burlington Residential Table, we are able to review the overall year-end statistics for 2021. It was reported that there were a total of 3,437 sales of residential properties in Burlington in 2021. This is a five per cent increase when compared to 2020, when Burlington saw a total of 3,272 sales in 2020.
It was also reported that when it can to the average price of a residential property there was a 23 per cent increase to $1,079,318. In 2020 the average price of a residential property was reported to be $877,809.
We can also take a look and see how many new listings were reported in 2021. There were a total of 4,020, this was a slight decrease of 4.6 per cent compared to 2020, with a total of 4,214. It’s interesting to look at each year and see what the differences were.
REALTORS® Association of Hamilton-Burlington Year-End 2021 Statistics
It’s been interesting taking a look back on both 2021 and 2020 and comparing the real estate statistics. To summarize these statistics, there were a total of 16,502 sales of residential properties. These sales were within the REALTORS® Association of Hamilton-Burlington market area for 2021.
With an average residential property price of $867,560, which was a 25.74 per cent increase when compared to 2020. “Burlington saw a decrease in listings by 4.46 per cent, an increase in sales by 5.04 per cent, and an increase in average price by 22.96 per cent to $1,079,317.”
“After a strong finish to the year in 2020, the market continued with feverish momentum fueled by high demand throughout 2021 which led to new records being recorded month after month.2021 marked the first year that greater than 16,000 residential transactions occurred in the RAHB market area with the previous record set in 2016. The record-high sales activity was supported by historically low mortgage rates. Real estate continues to be one of the best investments and it’s never too early to talk to a local RAHB REALTOR® about your real estate goals.” – RAHB’s 2022 President, Lou Piriano
For More Information About These Year-End Real Estate Statistics
If you’re interested in learning more about the overall RAHB 2021 year-end real estate statistics, please see the links below for the numerous year end statistical reports provided by the REALTORS® Association of Hamilton-Burlington.
- Residential Real Estate Market Comparison Tables for the Communities within the RAHB Market Area
- RAHB Residential Market At A Glance – Property Type Comparison
- Weekly Trends in 2021
- Market Activity Map of RAHB Communities
- RAHB Commercial Activity Table
- RAHB Total Market Activity Table
- Residential Stats Highlights 2021
- 1955-2021 Property Sales History Chart
Contact Lori VanDinther and Team
If you have any questions concerning these year-end real estate statistics please feel free to contact Lori today. She would be more than happy to help with your all of your Burlington real estate inquiries. If you’ve been wondering what your home is worth, you can give our What’s My Home Worth calculator a try.
Lori would love to connect with you if you have any questions and if interested in selling your home, so that she can help you find the home of your dreams. Please contact Lori by phone at (905) 632-2199, or by email at info@loriv.com.